International transport rates rarely move in a straight line. In 2026, importers may see a sharply different quote within days, even on the same trade lane. This raises a practical question: why do international shipping transport rates fluctuate every week? The answer usually combines vessel capacity, cargo demand, fuel expenses, port conditions, and market expectations.
Lars Jensen, founder of Vespucci Maritime, explains: “Freight rates are ultimately shaped by supply and demand.” His point is simple, but the market is not. When factories increase orders before a holiday season, carriers can fill available space quickly. A delayed vessel then creates a visible ripple. Containers wait beside a crowded terminal. Equipment becomes scarce. Spot prices rise before long-term contracts change.
Fuel prices matter too. So do canal disruptions, severe weather, labor negotiations, and blank sailings. A carrier may remove scheduled capacity to protect network reliability or support pricing. That decision can affect several ports at once. Currency movements also change the final cost for buyers and sellers.
Still, supply and demand do not explain everything. That is where analysis can become too confident. Public indexes show trends, not every private surcharge or contract condition. A reliable comparison should check the shipment date, route, container size, service type, and included fees. The lowest quote may exclude handling, documentation, or inland delivery.
This article examines the forces behind weekly rate changes. It also considers how shippers can read market signals without reacting to every temporary spike. Rates fluctuate. Planning should not.
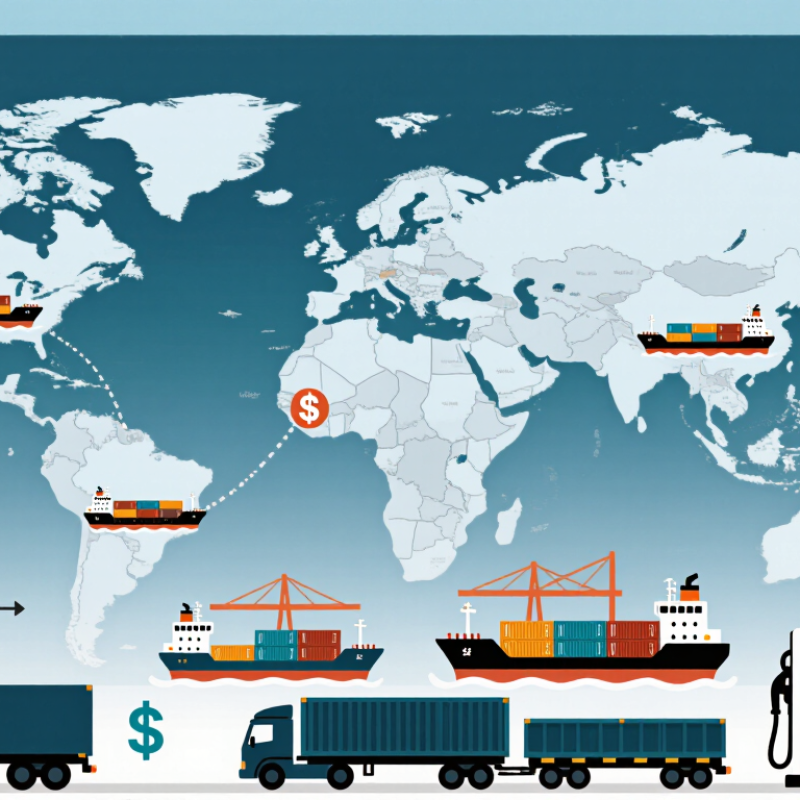
International transport rates are more than the ocean, air, or road movement itself. They usually include pickup, export handling, freight space, terminal charges, documentation, and delivery arrangements. Fuel adjustments, security fees, and currency changes can also appear. Import duties and local taxes are often separate. Always confirm this point in writing.
Carriers usually calculate charges from weight, volume, distance, transport mode, and cargo dimensions. A lightweight box may still cost more if it occupies unusual space. For example, a 120-centimeter pallet can receive a dimensional-weight charge instead of a weight-based charge. Route congestion, seasonal demand, port delays, and limited capacity may increase the final quote. In practice, an estimate can miss small handling fees. That is why experienced shippers compare the quote with the commercial invoice and packing details.
Tips: Measure every carton after packing, not before. Ask which fees are included, excluded, or estimated. Request the quote’s validity period because fuel and exchange rates can change quickly. Keep photographs of pallet size and labels for later checks. A licensed customs professional can clarify duties and local requirements. I have found that clear measurements prevent more disputes than aggressive price negotiation. Still, no calculation is perfect; unusual cargo, weather, or sudden congestion can change the result.
Global shipping prices move when cargo demand changes faster than vessel capacity. The WTO’s Global Trade Outlook and Statistics, published in April 2024, projected merchandise trade growth of 2.6% in 2024 and 3.3% in 2025. More orders can quickly fill available space. Rates then rise, especially before major retail seasons.
Supply shocks create sharper movements. UNCTAD’s Review of Maritime Transport 2024 reported that maritime trade grew by 2.4% in 2023. It also noted that route disruptions increased sailing distances and vessel demand. A ship diverted around a longer route needs more fuel, crew time, and capacity. Port congestion has a similar effect. Delayed containers can leave one region short of equipment while another region has empty boxes.
Fuel prices, weather, labor shortages, and canal restrictions add further pressure. Carriers may reduce departures when demand weakens, preventing rates from falling smoothly. This is called capacity management.
Small changes can become expensive. A missed sailing may delay production materials for several days.
The explanation is not perfect. Forecasts often miss sudden shocks. Demand data also arrives late. In practice, shippers should compare bookings, port dwell times, equipment availability, and fuel trends together. One indicator rarely explains the whole price movement. Price changes can feel irrational, but they usually reflect several pressures arriving at once.
International transport rates rarely move for one reason. In 2026, fuel costs remain a major influence on ocean, air, and road freight pricing. When crude prices rise, fuel surcharges can appear quickly on transport invoices. A long-haul truck feels this change within days. An aircraft may react even faster.
Capacity matters just as much. When vessels, aircraft, containers, or warehouse slots become scarce, providers can raise base rates. Peak agricultural exports often tighten equipment availability near major ports. Empty containers may also sit in the wrong locations. That imbalance creates extra repositioning costs. Small disruptions can become expensive.
Trade routes add another layer. A longer route increases fuel use, crew time, insurance exposure, and handling charges. Port congestion can force cargo through less familiar gateways. That choice may reduce delays, but it can increase inland transport costs. Rate comparisons should include the whole route, not only the headline freight charge. Teams should check fuel indexes, available capacity, port conditions, and seasonal demand before approving a quote. Still, forecasts are imperfect. A sudden storm or policy change can overturn careful planning. My view is simple: use current data, keep alternatives open, and question unusually low prices.
| Rate Driver | Typical Market Indicator | Observed or Common Range | Effect on Transport Rates | Why It Matters | Typical Time Lag |
|---|---|---|---|---|---|
| Marine fuel and diesel prices | Fuel cost as a share of operating expenditure | Approximately 20%–40% for ocean services; often 25%–45% for road freight | Higher fuel prices usually increase rates | Fuel is a direct voyage and trucking expense. Carriers may recover part of the change through fuel-adjustment mechanisms. | Days to several weeks |
| Available vessel, aircraft, truck, and rail capacity | Capacity utilization | Rates generally become more sensitive when utilization moves above roughly 85%–90% | Tighter capacity raises rates | When available space is limited, shippers compete for bookings and carriers gain greater pricing power. | Immediate to 2 months |
| Oversupply of transport capacity | Fleet growth compared with cargo demand | Capacity growth exceeding demand by several percentage points can create downward pricing pressure | More unused capacity usually lowers rates | Empty slots and repositioning costs encourage carriers to offer discounts or reduce surcharges. | 1–6 months |
| Canal, strait, and port disruptions | Additional sailing distance or waiting time | Detours around major maritime chokepoints can add thousands of nautical miles and approximately 1–3 weeks to some voyages | Rates and surcharges usually increase | Longer routes consume more fuel, vessels, crew time, and insurance capacity while reducing the number of available round trips. | Immediate to several weeks |
| Port congestion and inland bottlenecks | Berthing delay, container dwell time, or truck turnaround time | Severe congestion can extend cargo cycles from hours to multiple days | Higher rates and congestion fees are possible | Equipment becomes unavailable for new shipments, schedules become less reliable, and shippers may pay for priority handling or alternative gateways. | Days to 2 months |
| Seasonal demand | Pre-holiday, harvest, and peak retail shipping volumes | Demand commonly rises several weeks before major regional shopping or agricultural seasons | Peak-season rates tend to rise | Short-term demand increases can absorb spare capacity faster than operators can add vessels, aircraft, trucks, or rail equipment. | 2–12 weeks |
| Trade imbalances | Difference between export and import volumes on a route | Persistent one-way flows can create equipment shortages in lower-volume markets | Rates rise in the constrained direction | Empty containers and vehicles must be repositioned, adding handling, storage, and inland transport costs. | Several weeks to months |
| Exchange-rate movements | Local currency versus the billing currency | A 5%–10% currency movement can materially change the local cost of a freight invoice | Effect depends on the contract currency | Currency changes influence fuel purchases, port fees, labor costs, and the final amount paid by importers or exporters. | Immediate to 3 months |
| Weather and natural hazards | Storm closures, low water levels, fog, flooding, or extreme heat | Disruptions may last from several hours to multiple weeks | Temporary rate increases are common | Weather reduces effective capacity, creates delays, and can force cargo onto more expensive routes or transport modes. | Immediate to several weeks |
| Regulation, emissions, and security requirements | Compliance cost per voyage, shipment, or vehicle movement | Costs vary by route, fuel type, cargo category, and applicable environmental or security rules | New compliance costs can increase rates | Operators may invest in cleaner fuels, emissions controls, security measures, reporting systems, or slower operating speeds. | Months to years |
| Contract versus spot pricing | Length and flexibility of the freight agreement | Spot prices can change daily or weekly; contracts usually reset less frequently | Short-term rates are more volatile | Contracted prices provide budget stability, while spot pricing reflects current fuel costs, demand, capacity, and disruption risk. | Spot: days; contracts: months or quarters |
| Mode substitution | Switching between ocean, air, rail, road, or multimodal transport | Air freight is generally faster but substantially more expensive per kilogram than ocean freight | Impact depends on urgency and cargo value | Shippers may pay a premium to protect production schedules when the normal route is delayed or capacity constrained. | Immediate to several weeks |
Why Do International Transport Rates Fluctuate?
International transport rates change when available capacity meets uneven demand. UNCTAD’s Review of Maritime Transport 2024 reported 2.4% maritime trade growth in 2023. It expected slower growth of about 2% in 2024. That small difference can still shift booking pressure, vessel space, and container prices.
Seasonal demand makes the movement visible. Before major holidays, importers often fill warehouses, creating short bursts of bookings. Ports then face crowded yards, longer truck queues, and higher equipment repositioning costs. After the peak, demand may fall quickly. Rates can soften, but not always immediately. Empty containers may remain in the wrong locations.
Economic and geopolitical events create sharper swings. The World Bank’s Global Economic Prospects, January 2025, projected global growth of 2.7% in both 2025 and 2026, suggesting steady but uneven cargo demand. Meanwhile, UNCTAD reported that vessel diversions around Africa lengthened voyages and reduced effective capacity on major routes. Fuel prices, insurance, port delays, and security concerns then add pressure. The International Energy Agency’s Oil Market Report also shows how energy demand forecasts can change, affecting bunker-cost expectations. Forecasts still miss sudden shocks. That is the uncomfortable part. A rate quote may look reasonable today, yet become outdated after one storm, strike, or regional escalation.
Seasonal demand, economic cycles, fuel costs, supply-chain disruptions, and geopolitical events can quickly change the balance between shipping capacity and cargo demand.
The chart uses approximate annual averages of the dry-bulk freight benchmark, with 2019 set as the pre-pandemic reference period. Rates fell during the 2020 demand shock, surged in 2021 as economies reopened and supply chains tightened, and remained elevated in 2022 amid energy-market pressure and geopolitical disruption. Lower demand and improved vessel availability reduced the average in 2023, while rerouting and regional security risks supported a partial increase in 2024. Source: publicly reported annual benchmark averages and World Bank commodity-market data.
International transport rates rarely move for one reason. Fuel, vessel capacity, port delays, currency shifts, and seasonal demand interact. UNCTAD’s Review of Maritime Transport 2024 reported that global maritime trade grew 2.4% in 2023. It also warned that disruptions and rerouting increase sailing distances, fuel use, and costs. Small shocks become visible on invoices.
Businesses need a lane-level monitoring routine, not occasional rate checks. Record base freight, fuel adjustments, terminal fees, transit time, and quote expiry dates. Compare weekly changes with public freight indicators and port performance data. The World Bank’s Logistics Performance Index 2023 highlights timeliness and infrastructure as core logistics capabilities. A delayed connection can cost more than a higher initial quote. Set alerts for a 10% weekly increase or a three-day transit extension. Ask for the cost driver, not only a revised total.
Management works better with scenarios. Build low, expected, and stress-case budgets. Review currency exposure and fuel formulas before signing contracts. Use adjustment clauses with clear data sources and review dates. Keep alternative routes when volume justifies them. Flexibility has value. Forecasts still fail. A team may overreact to one disruption and overstock inventory. Monthly reviews should track landed cost, delivery reliability, and stockout risk together. A cheap route is not cheap when customers wait.
They may include pickup, export handling, freight space, terminal charges, documents, and delivery arrangements. Import duties and local taxes are often separate. Confirm everything in writing.
Providers usually consider weight, volume, distance, transport mode, and cargo dimensions. A lightweight box can cost more when it occupies unusual space. Space matters.
Dimensional weight charges cargo by the space it uses, not only its actual weight. A 120-centimeter pallet may receive this charge. Measure after packing.
Fuel adjustments, security fees, currency changes, terminal handling, and small documentation charges may appear. Estimates can miss minor handling costs. Check the details carefully.
Higher fuel prices can quickly increase surcharges for ships, aircraft, and trucks. Long-haul trucks may reflect changes within days. Aircraft costs can react faster.
Scarce containers, warehouse slots, vessels, or aircraft can raise base rates. Empty containers in the wrong locations may create repositioning costs. Small disruptions grow expensive.
Longer routes use more fuel and crew time. They can also increase insurance exposure, handling charges, and inland transport costs. Compare the whole route.
Record base freight, fuel adjustments, terminal fees, transit time, and quote expiry dates. Review changes weekly. Set an alert for a 10% weekly increase.
Create low, expected, and stress-case budgets. Keep alternative routes when shipment volume supports them. Forecasts still fail, so review delivery reliability and stockout risk monthly.
International transport rates are made up of several components, including base freight charges, fuel surcharges, port handling fees, customs-related costs, insurance, and inland delivery expenses. These rates are calculated according to factors such as shipment volume, cargo type, distance, service level, route availability, and current market conditions. Understanding these elements helps businesses evaluate quotations and identify the reasons behind unexpected cost changes.
Many companies ask, “why do international shipping transport rates fluctuate every week?” The answer often involves changing supply and demand, fuel prices, available vessel or aircraft capacity, port congestion, and adjustments to trade routes. Seasonal peaks, economic shifts, weather disruptions, and geopolitical events can also affect transit costs and schedules. To manage these changes, businesses should compare reliable rate information, monitor market trends, plan shipments in advance, use flexible routing options, and maintain clear communication with logistics partners.

LoJo Logistics